Data as at 25 March 2025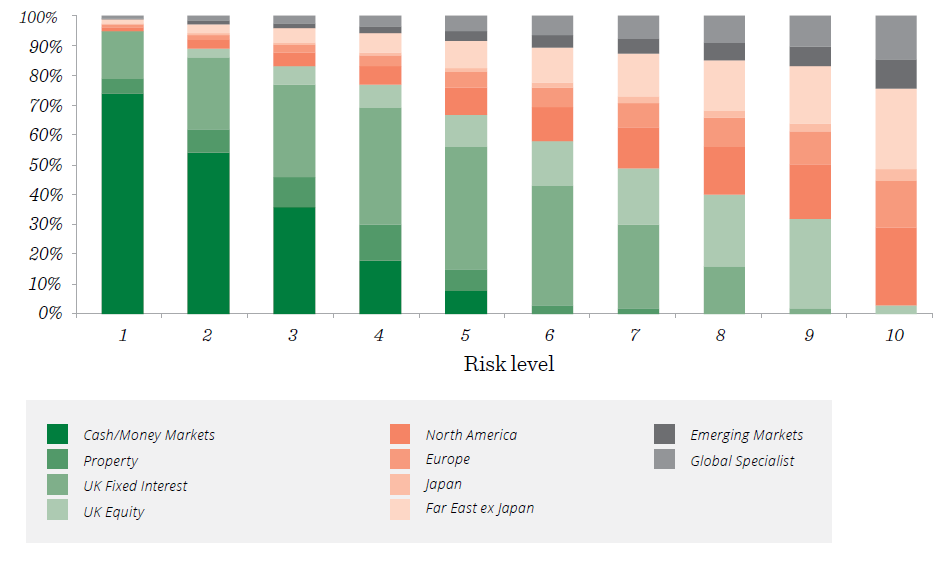
| Risk Level | 1 | 2 | 3 | 4 | 5 | 6 | 7 | 8 | 9 | 10 |
| Cash / Money Markets | 74.00% | 54.00% | 36.00% | 18.00% | 8.00% | - | - | - | - | - |
| Property | 5.00% | 8.00% | 10.00% | 12.00% | 7.00% | 3.00% | 2.00% | - | - | - |
| UK Fixed Interest | 16.00% | 24.00% | 31.00% | 39.00% | 41.00% | 40.00% | 28.00% | 16.00% | 2.00% | - |
| International Fixed Interest | - | - | - | - | - | - | - | - | - | - |
| UK Equity | - | 3.00% | 6.00% | 8.00% | 11.00% | 15.00% | 19.00% | 24.00% | 30.00% | 3.00% |
| North America | 1.35% | 2.97% | 4.59% | 6.21% | 8.91% | 11.34% | 13.77% | 16.20% | 18.36% | 26.19% |
| Europe | 0.80% | 1.76% | 2.72% | 3.68% | 5.28% | 6.72% | 8.16% | 9.60% | 10.88% | 15.52% |
| Japan | 0.20% | 0.44% | 0.68% | 0.92% | 1.32% | 1.68% | 2.04% | 2.40% | 2.72% | 3.88% |
| Far East ex Japan | 1.40% | 3.08% | 4.76% | 6.44% | 9.24% | 11.76% | 14.28% | 16.80% | 19.04% | 27.16% |
| Emerging Markets | 0.50% | 1.10% | 1.70% | 2.30% | 3.30% | 4.20% | 5.10% | 6.00% | 6.80% | 9.70% |
| Global Specialist | 0.75% | 1.65% | 2.55% | 3.45% | 4.95% | 6.30% | 7.65% | 9.00% | 10.20% | 14.55% |
| Total | 100.00% | 100.00% | 100.00% | 100.00% | 100.00% | 100.00% | 100.00% | 100.00% | 100.00% | 100.00% |